




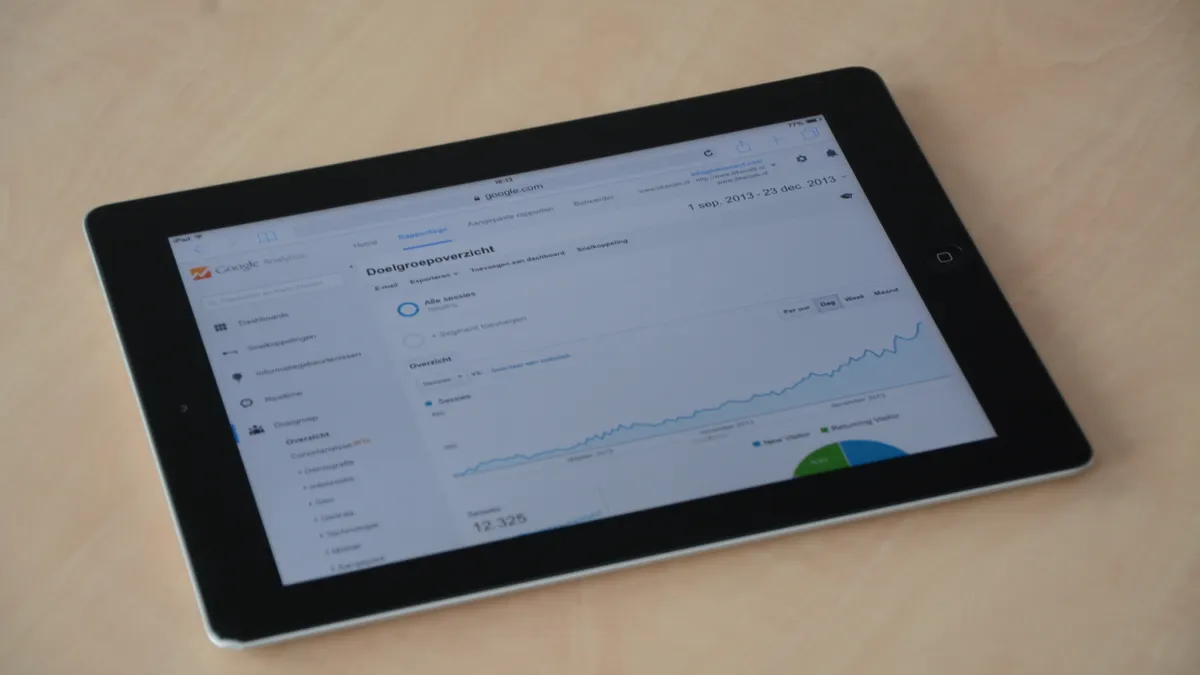
How to Build a SaaS Content Performance Dashboard for Traffic, Engagement, and Lead Signals: a SaaS content performance dashboard should center on 3…
Last updated: November 20, 2026
Quick answer: a SaaS content performance dashboard should center on 3 metric groups—traffic, engagement, and lead signals—so a content team can see which pages attract the right visitors and which pages help create demand. Build it around a small set of metrics, split the view by content type and funnel stage, and review it on a steady cadence instead of chasing every daily swing.
Key takeaways
- Start with one dashboard, not three. Traffic, engagement, and lead signals belong together when the goal is content performance.
- Use a short list of metrics that answer three questions: who arrived, what they did, and whether they showed buying intent.
- Keep the layout simple enough to read in under 2 minutes on a phone or laptop.
- Review trends at a fixed pace, such as weekly for operations and monthly for direction.
- Do not confuse a content performance dashboard with a decay monitor, experiment log, or prioritization matrix. Those solve different problems.
What should a SaaS content performance dashboard answer?

A SaaS content performance dashboard should answer three plain questions: did the content bring the right traffic, did that traffic engage, and did it produce lead signals that matter. That is the real job of the SaaS content performance dashboard for a SaaS team, not just a pile of charts.
Traffic tells you whether the page is being found. Engagement tells you whether the page held attention long enough to matter. Lead signals tell you whether the page moved a reader closer to a demo request, trial, newsletter signup, or sales handoff.
A generic analytics view often fails here because it mixes all site activity together. A SaaS dashboard should isolate content pages from product pages, home pages, and support docs when possible. It can also help to separate top-of-funnel educational posts from bottom-of-funnel pages, because a post that earns 1,000 visits and no lead signals may still be useful if it fills the top of the funnel.
The dashboard also needs a time frame. Without a 7-day, 30-day, and 90-day view, one strong campaign can hide a weak content base. Time matters because SaaS content often has a lag between first visit and lead action.
This is the place to connect the dashboard back to the broader SaaS content production and optimization process. It should sit beside the planning and production workflow, not replace it.
Which metrics belong in the dashboard?
The dashboard should include a small set of traffic, engagement, and lead-signal metrics, plus one or two context metrics so the numbers make sense. If a metric does not change a decision, leave it out.
For traffic, use page views, unique users, and entrance traffic for the content set. Page views show raw demand. Unique users help reduce the effect of repeat visits. Entrance traffic helps identify which content pages are acting as landing pages instead of internal support pages.
For engagement, use engaged sessions, average engagement time, scroll depth if your analytics tool tracks it, and click-throughs to next-step content. Engagement should answer whether the reader stayed with the page long enough to consume it. A long page view with no interaction is not the same as a useful session. Google Analytics 4 documents engaged sessions and engagement time as core engagement measures. (Source: Google Analytics Help)
For lead signals, track demo clicks, trial starts, newsletter signups, contact-form submissions, and clicks to pricing or case-study pages. These are not all equal, so label them by stage. A pricing-page click is not the same as a form fill, but both can matter.
A simple way to decide what stays on the dashboard is to ask whether the metric changes a content decision in the next 30 days. If the answer is no, it probably belongs in a deeper report, not the main dashboard.
How do you measure blog performance?
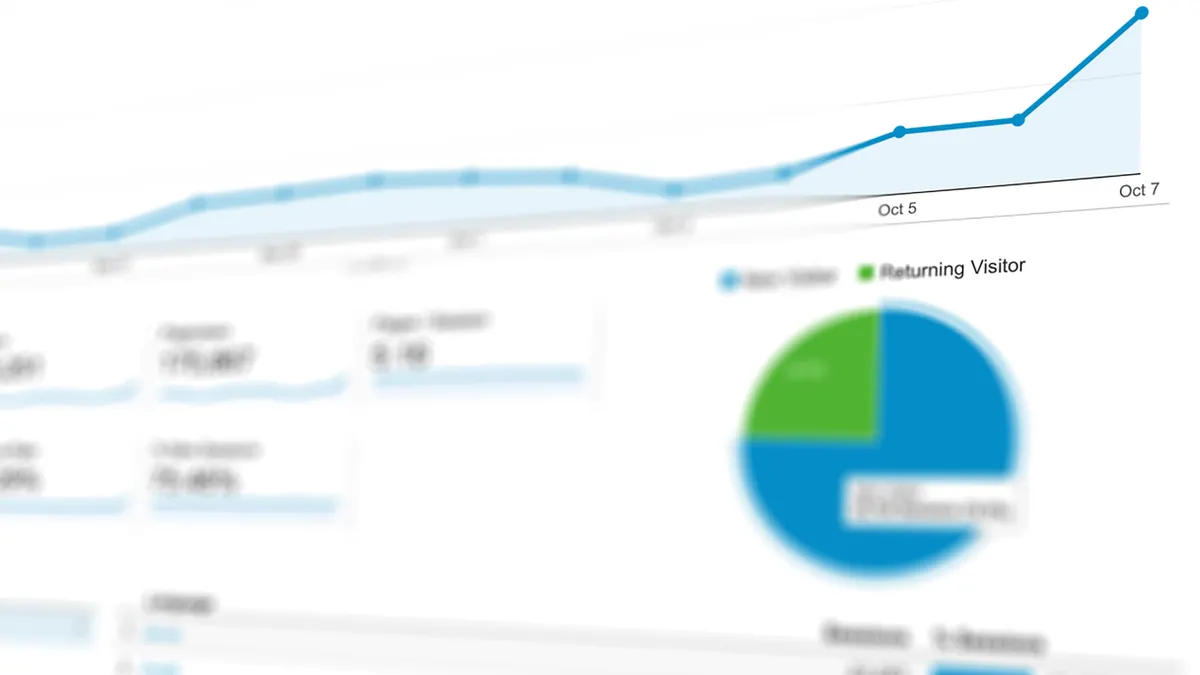
You measure blog performance by combining page-level traffic with on-page engagement and the lead actions that happen after the visit. A blog dashboard that only shows visits misses the point, because traffic without action can still be low-value.
Start with the blog pages that matter most to the business, not every post from the last 5 years. Group them by intent: problem-aware posts, solution-aware posts, and comparison or purchase-adjacent posts. That grouping makes the numbers easier to read and helps separate education from demand capture.
Then measure each group against the same three layers:
- Traffic: page views, unique users, and landing-page sessions
- Engagement: engaged sessions, average engagement time, and internal clicks
- Lead signals: newsletter signup, demo click, trial click, or contact click
If you use Google Analytics 4, its event model is a strong fit for this kind of dashboard because it lets you define and track actions instead of only page views. If the team already uses HubSpot or another CRM, the dashboard should also pull in lead-stage data so content can be tied to actual contacts, not just anonymous visits. HubSpot’s reporting guidance also emphasizes connecting marketing activity to leads and contacts. (Source: HubSpot)
The useful part is not the raw total. It is the pattern. A post with modest traffic but high lead clicks may deserve a different next step from a post with large traffic and weak engagement. The dashboard should make that difference visible in 10 seconds.
How should the dashboard be laid out?
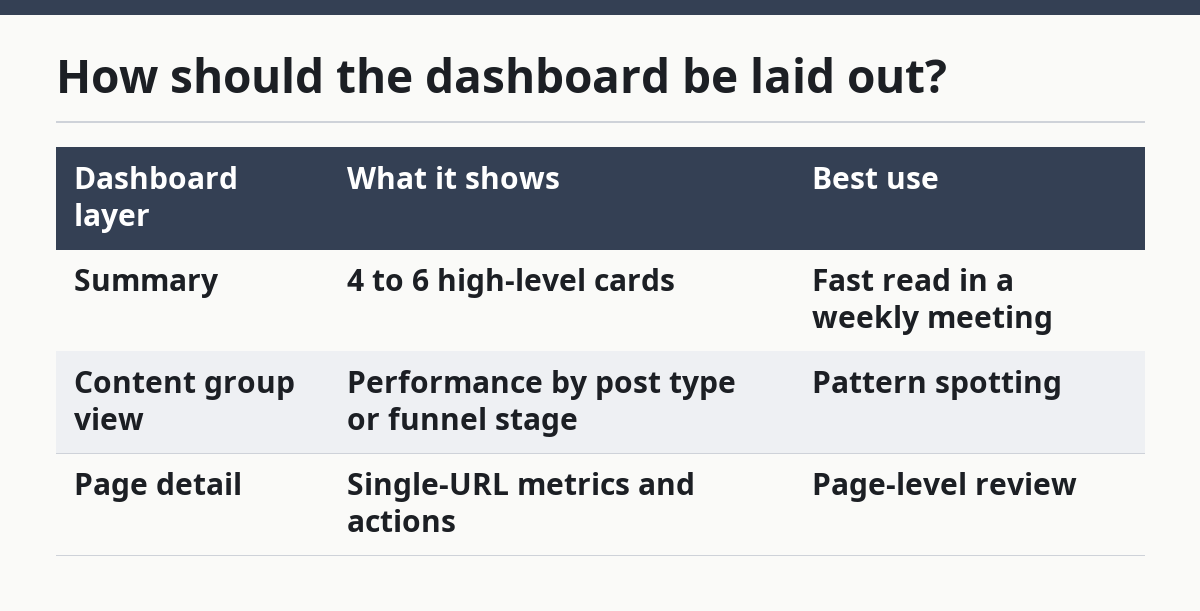
The dashboard should be laid out in 3 layers so a reader can scan it from top to bottom in under 2 minutes. The top layer shows the business summary, the middle layer shows content-level performance, and the bottom layer shows page detail.
The top layer should contain 4 to 6 summary cards. Put traffic, engagement, and lead signals side by side, along with a time filter such as 7 days, 30 days, and 90 days. This gives a quick read without forcing the viewer into charts first.
The middle layer should compare content groups. Use one bar chart or table for top pages by traffic, one for pages by engagement, and one for pages by lead signals. A table can be the fastest tool when the team needs to act on specific URLs during weekly review.
The bottom layer should show page details for a selected URL: title, publish date, category, source, traffic, engagement, and lead action count. That way the dashboard can answer the question, “What happened on this page?” without opening a second report.
A useful layout also leaves room for filters. Minimum filters should include content type, funnel stage, date range, and channel source. Too many filters make the dashboard slow to use, so keep the first screen simple.
| Dashboard layer | What it shows | Best use |
|---|---|---|
| Summary | 4 to 6 high-level cards | Fast read in a weekly meeting |
| Content group view | Performance by post type or funnel stage | Pattern spotting |
| Page detail | Single-URL metrics and actions | Page-level review |
What tools and data sources do you need?
You need one analytics tool, one dashboard layer, and one source of lead data to make the report useful. Without all 3, the picture stays partial.
The analytics tool is the source for traffic and engagement. Google Analytics 4 is the most common example because it can track events, sessions, and page-level behavior in one place. A heatmap or session-recording tool can help with interpretation, but it should not be the main dashboard source.
The dashboard layer is where the numbers live together. That can be a BI tool, a spreadsheet, or a native dashboard inside your analytics stack. The choice depends on how many sources need to be joined and how often the report will be used. If the team only needs a weekly readout, a lighter setup may be enough. If the team needs CRM matching and content tagging, a BI layer is usually easier to manage.
The lead source should come from the system that holds form fills, demo requests, trials, or MQL-stage events. That may be a CRM or marketing automation tool. The important part is that the dashboard can connect content visits to a lead signal without making the reader jump between tabs.
The honest trade-off is simple: a lighter setup is faster to build, but it gives less context; a deeper setup gives better decisions, but it takes more upkeep. A dashboard that needs 4 separate exports every Monday will lose the team quickly.
How often should the dashboard be reviewed?
The dashboard should be reviewed on 2 rhythms: weekly for action and monthly for direction. That split keeps the team from overreacting to small swings while still catching issues fast enough to matter.
A weekly review is enough for traffic changes, broken lead paths, and sudden drops in engagement. It works best when the dashboard is used by the people who own content production, SEO, and demand generation. The question for the weekly meeting is simple: what changed, and does it need action now?
A monthly review should look for content themes, page groups, and funnel movement. This is the right time to compare 30-day and 90-day views, because content rarely tells its full story in 7 days. Monthly review is also where the team should decide whether certain page types are helping pipeline, not just visits.
Do not review the dashboard daily unless the site has very high volume or a launch is underway. Daily checks tend to produce noise. They also make people focus on one post instead of the content system as a whole.
A 30-minute monthly review and a 10-minute weekly review are usually enough for a small team. If the process takes much longer, the dashboard is probably trying to do too much.
What mistakes should you avoid?
The biggest mistake is tracking too many metrics and too many pages in one view. That usually costs the team clarity, because nobody can tell which number matters. A dashboard with 20 charts looks active, but it often slows decisions.
Another mistake is treating traffic as success on its own. High traffic can hide poor fit, weak engagement, or no lead movement. If you are unsure how to weigh traffic against pipeline impact, consult your analytics or revenue operations team; Google Analytics also makes it clear that engagement and conversions matter alongside traffic. (Source: Google Analytics Help)
A third mistake is mixing content pages with unrelated site pages. If blog posts, pricing pages, and help docs all live in one report with no filters, the dashboard becomes hard to trust. The fix is to tag content types and keep the default view focused on the content set.
A fourth mistake is forgetting the time frame. A page that looks weak in 7 days may be normal at 90 days. Without consistent windows, the dashboard turns into a debate about timing instead of a report about performance.
The last mistake is building the dashboard before deciding who uses it. A content lead needs different detail than a founder or sales manager. If the audience is not clear, the layout usually grows cluttered and hard to read.
How do you keep it useful as the content library grows?
You keep it useful by reviewing the metric list every quarter and removing anything that no longer supports a decision. A dashboard that starts simple can drift into clutter after 6 or 12 months.
As the library grows, add page tags for intent, format, and funnel stage. Those tags let the dashboard answer bigger questions without turning into a separate research project. For example, the team can compare comparison posts against problem-aware posts, or webinar pages against blog posts, using the same report.
It also helps to keep one naming standard for the content set. If one team calls a page “blog,” another calls it “article,” and a third calls it “resource,” the dashboard will fracture. A clean taxonomy matters more than a fancy chart.
One sign the dashboard is still working is that it helps the team make the next week’s content decision in a few minutes. If the report becomes a monthly ritual with no action, it needs to be trimmed.
What metrics belong in a SaaS content dashboard?
A useful SaaS content dashboard includes traffic, engagement, and lead signals. Traffic shows reach, engagement shows attention, and lead signals show business movement. If a metric does not help decide what to publish, fix, or promote next, it should stay out of the main view. For a broader planning reference, see our content strategy page and marketing dashboard guide.
How do you measure blog performance?
Blog performance is measured by combining page-level traffic, engagement, and lead actions. That means looking at visits and unique users, but also at engagement time, internal clicks, and conversions such as demo requests or trial starts. A blog post that brings fewer visits but more lead actions can still be the stronger page. If you want to connect those actions to event tracking, see our GA4 event tracking article and SaaS SEO overview.
How often should content performance be reviewed?
Review content performance weekly for short-term action and monthly for bigger pattern checks. Weekly reviews catch drops, spikes, and broken paths fast. Monthly reviews give enough time for content to show whether it is producing consistent traffic, engagement, and lead signals. For planning the workflow around those reviews, our content planning page explains the cadence in more detail.
Drafted with AI; not yet reviewed by a person.