





How to Build a SaaS Competitive Positioning Grid for Messages, Proof, and Differentiators: A SaaS competitive positioning grid usually works best with 4…
Last updated: November 15, 2026
Quick Answer: A SaaS competitive positioning grid usually works best with 4 to 8 competitors, 5 columns, and 3 source page types per brand. A SaaS competitive positioning grid is a simple way to line up competitors on three things that shape buying decisions: messages, proof, and differentiators. Use How to Build a SaaS Competitive Positioning Grid when homepage claims sound similar, proof is vague, and your team needs to see where a product actually stands in plain language. For related context on SaaS positioning research and competitive analysis frameworks, this grid sits in the middle: it is the comparison layer, not the source layer.
Key takeaways
- A good grid compares the words a company uses, the evidence it shows, and the claim it tries to own.
- The most useful version stays small enough to scan on one screen, then expands only where a competitor is clearly different.
- The point is not to rank products. The point is to spot where the market says the same thing in five different ways.
- Proof matters as much as messaging. A claim with no case study, benchmark, logo, or product detail is weak even if it sounds sharp.
- The grid is strongest when it makes gaps visible: generic claims, copied phrases, and false sameness.
What does a competitive positioning grid show?

A competitive positioning grid shows where each SaaS product sounds distinct and where it blends into the crowd. It puts competitors in one view so homepage messaging, proof points, product claims, and category fit are easier to compare.
The cleanest version tracks 4 to 8 competitors, because more than that turns the page into a wall of noise. Add the direct competitors first, then the near alternatives buyers mention in the same shortlist. If a team sells into a narrow segment, a 3-by-3 grid can be enough; if the category is crowded, a 6-column view is usually the limit before the page gets hard to read.
A generic article often treats positioning as a slogan problem, but a team should verify that with a professional review of the page and the market signals if the stakes are high. Positioning is not just the promise on the headline. It is the pattern across the hero line, the subhead, the proof, the product screenshots, and the language repeated in the rest of the page.
A strong grid helps answer one practical question: “If a buyer reads the top of these sites in 10 minutes, what would they think each tool is for?” That is the test. If two products sound the same at that speed, the grid should show it.
For this topic, How to Build a SaaS Competitive Positioning Grid belongs in the same conversation as public signals and audience research, which is why it fits the broader hub on SaaS audience and positioning signals. It is the comparison layer, not the source layer.
What columns should the grid have?
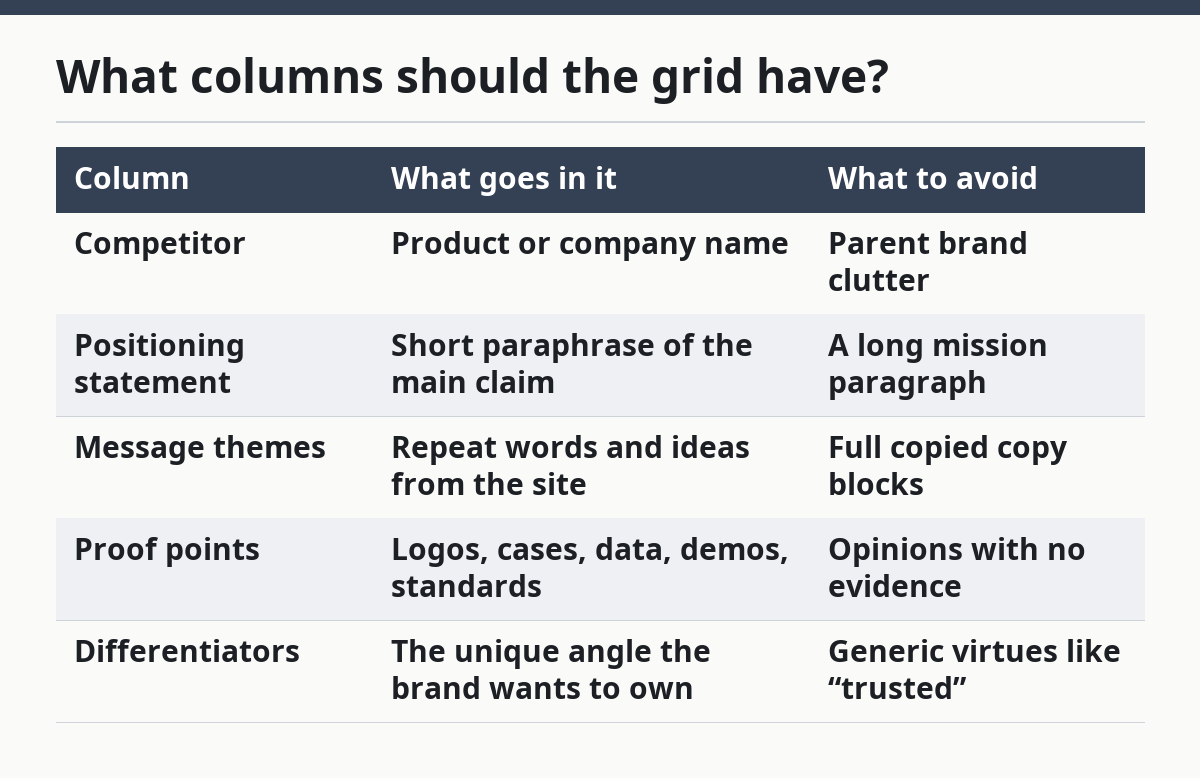
A useful grid usually has 5 columns: competitor name, positioning statement, message themes, proof points, and differentiators. That layout gives enough detail to compare without turning the sheet into a content audit.
The first column is the product name. The second is the positioning statement, copied or closely paraphrased from the homepage or a main landing page. Keep it short, around one line, so the team sees the claim before the explanation. The third column lists the repeated message themes, such as speed, automation, team control, AI, compliance, or visibility.
The fourth column holds proof points. These are the things the site uses to support the claim: customer logos, quantified results, case studies, testimonials, product screenshots, integration badges, standards references, or comparison pages. The fifth column is the differentiator. This is not “better support” or “easy to use.” It should be the exact angle the product tries to own, such as “built for finance teams,” “replaces manual review,” or “works before implementation.”
A 4-column version can work if the team is small. In that case, combine message themes and differentiators into one column and keep proof separate. If the goal is message comparison, do not add extra fields like pricing, feature lists, or review scores unless they directly affect the claim. Those belong in a different grid. For a deeper pricing read, see SaaS pricing comparison.
| Column | What goes in it | What to avoid |
|---|---|---|
| Competitor | Product or company name | Parent brand clutter |
| Positioning statement | Short paraphrase of the main claim | A long mission paragraph |
| Message themes | Repeat words and ideas from the site | Full copied copy blocks |
| Proof points | Logos, cases, data, demos, standards | Opinions with no evidence |
| Differentiators | The unique angle the brand wants to own | Generic virtues like “trusted” |
How do you build a SaaS competitive positioning grid?

You build a SaaS competitive positioning grid by collecting the same page types for each competitor, then reducing them to comparable claims and evidence. The work is part reading, part sorting, and part restraint.
- Pick 4 to 8 competitors and one market lens. Use the competitors a buyer would actually compare in one sitting, not every brand in the category. One lens is enough here, such as “best for mid-market teams” or “built for technical users.”
- Capture the homepage, one product page, and one proof page for each brand. Three page types are enough to show the message pattern. If the homepage and product page say one thing but the proof page says another, that difference matters.
- Write the positioning statement in one sentence. Keep it to the core promise, not the full marketing copy. A good test is whether a teammate can read it aloud in under 15 seconds.
- List 3 to 5 message themes. Use the same labels across every competitor so the comparison stays clean. If one site says “speed” and another says “faster workflows,” put both under the same theme unless the wording changes the claim.
- Log the proof next to each claim. A statement about enterprise trust without logos, case studies, or standards is not the same as a statement with a named customer and a product screenshot.
- Mark what is missing. Empty cells are useful. If every competitor claims automation but only one shows product detail, the gap is part of the positioning story.
- Summarize the pattern in one line. The end result should say something like: “Four competitors promise speed, but only one proves it with workflow detail and customer evidence.”
This process usually works best in a spreadsheet, because the grid needs quick sorting and copying. A slide deck can show the result later, but the first draft should stay editable. If the table gets longer than one screen without scrolling, it is probably trying to answer more than one question.
How do you compare messages, proof, and differentiators?
You compare messages, proof, and differentiators by asking whether the claim, the evidence, and the market angle all point in the same direction. If they do not, the positioning is weak or incomplete.
Messages are the words. Proof is the support. Differentiators are the reason the promise should matter here instead of with another vendor. A site that says “built for scale” but shows no enterprise logos, no security language, and no operational detail is making a broad claim with thin support. A site that says “simple for small teams” and shows a 2-step setup, small-team testimonials, and light UI screenshots is much easier to believe.
The table below shows the difference in a compact way.
| What you see | What it means | What to do with it |
|---|---|---|
| Strong claim, weak proof | The brand wants trust without evidence | Flag it as a messaging gap |
| Weak claim, strong proof | The site has evidence but no sharp angle | Rewrite the positioning statement |
| Strong claim, strong proof | The message and support align | Note the territory it owns |
| Similar claim across 4 competitors | The category is crowded on that angle | Look for a new angle or audience split |
The best grid also notes which competitor owns which line of attack. One may lead with speed, another with control, another with compliance, and another with category leadership. The point is not that one theme is always better in every market. The point is that a theme becomes less persuasive when five competitors say the same thing with the same proof pattern.
For SaaS, proof is often the tie-breaker. Two products can both claim “simple onboarding,” but one may show a 3-step setup and the other may offer only a slogan. That difference matters because buyers read proof as a risk signal. A claim without evidence can still attract attention, but it rarely carries the page. If a team is making a purchase decision on that basis, a professional review can help validate the read.
What makes a grid useful instead of busy?
A useful grid makes the differences obvious in under 2 minutes, while a busy one hides them under copy fragments. The trick is to reduce every competitor to the same 3 to 5 signals, then keep the wording parallel.
Use short labels and a fixed reading order. Start with the claim, then the message themes, then the proof, then the differentiator. If you reorder columns for one competitor, the comparison breaks. A grid also gets weaker when it tries to mix feature comparison, pricing, and messaging in the same row. That creates a table that looks complete but answers nothing clearly.
A useful rule is to keep one cell to one idea. “Customer trust” is too vague. “Customer logos from mid-market B2B teams” is better. “Automation” is too broad. “Auto-routes incoming requests to one of three queues” is sharper. The more concrete the cell, the easier it is to spot overlap.
The other reason grids fail is false symmetry. Not every competitor deserves the same amount of detail. If one company has a distinct proof stack and another has almost none, the difference should be visible. Equal length can make unequal products look equally sharp, which hides the market story.
A good grid usually leads to one decision: which claim space is crowded, which proof style is overused, and where a product can speak more clearly. If the grid does not change a headline, a proof page, or a launch brief, it was probably too broad.
What are the common mistakes?
The most common mistake is turning the grid into a list of features instead of a positioning view. That costs clarity, because feature lists tell you what ships, not what the market hears. The fix is to write the claim first and let features stay in the background unless they support the claim.
A second mistake is quoting homepage copy word for word across every competitor. That wastes time and hides the pattern. Copying text makes the table look exact, but it also makes comparison slower. Paraphrase to the same level of detail for every brand so the reader can scan for differences in 20 seconds, not 2 minutes.
A third mistake is treating proof as a footnote. That costs credibility. If one competitor backs “enterprise-ready” with standards references and named customers while another shows only a logo strip, the difference is not minor. Proof should get its own column, not a note in the margin. If the team is unsure how to judge what counts as sufficient proof, consult a professional analyst or strategist and verify against current market sources.
A fourth mistake is comparing too many competitors at once. More than 8 brands usually makes the grid noisy unless the categories are extremely close. Narrow the list before adding more cells. A smaller, sharper grid is more useful than a long one that nobody can interpret.
A final mistake is forgetting category fit. Some claims only make sense for certain buyers. “Built for small teams” is not the same thing as “built for regulated teams,” even if both products use the word “simple.” If the audience changes, the positioning changes too.
How do you turn the grid into a decision?
You turn the grid into a decision by using it to pick the claim space, proof style, and audience angle that are least crowded. That is the point where the sheet becomes a tool instead of a record.
Start with the cells that repeat across competitors. If five brands say the same thing, that message is no longer a differentiator. Next, look for proof gaps. If competitors promise the same outcome but only one shows real evidence, that is a place where a stronger proof stack can matter more than a new slogan. Then check for audience splits. A product may be crowded in general but clear for one segment, such as technical teams, finance teams, or small operators.
The decision should be specific enough to change work. It might lead to a new homepage headline, a better proof section, a tighter comparison page, or a reworded product claim. If the grid only produces a vague note like “differentiate more,” it has not done its job.
That is why the best positioning grid is not a one-time exercise in practice. It is a working document that gets updated when the homepage changes, a proof page is added, or a competitor shifts language. Even one new case study can change the balance. A 5-row grid that is current is more valuable than a 20-row grid that is stale.
A positioning grid is not for teams that want a full market map or a deep feature matrix. It is for teams that need a fast read on message overlap and proof quality. If the goal is buyer-level pricing comparison or feature-level procurement review, this is the wrong tool, and a more specialized review is a better fit.
How do you compare SaaS positioning?
You compare SaaS positioning by lining up the claim, the proof, and the audience for each product in the same format. That makes overlap and difference visible without reading every page in full. The comparison works best when it stays small, usually 4 to 8 competitors, and uses the same source pages for each one.
What is a positioning grid?
A positioning grid is a side-by-side table that shows how each competitor presents its value. It usually includes the main message, proof points, and differentiators, so the reader can see where brands sound alike and where they do not. In SaaS, it is most useful when the category has crowded homepage claims.
How do you compare competitors’ messaging?
You compare competitors’ messaging by grouping the repeated words and ideas they use, then checking whether the proof matches the promise. A message like “fast setup” should be judged against screenshots, setup steps, or customer evidence, not against another slogan. The best comparison shows both the words and the support in one view.
Drafted with AI; not yet reviewed by a person.