



How to Build a SaaS Launch Signal Heatmap for Teasers, Waitlists, and Quiet Rollouts: A launch signal heatmap turns teasers, waitlists, beta invites…
Last updated: November 17, 2026
A launch signal heatmap turns teasers, waitlists, beta invites, product pages, and social posts into a simple grid that shows what is getting louder, earlier, and more public. Build it to spot release intensity fast, not to keep a perfect event log.
Key takeaways
- Group signals by visibility and timing so one teaser does not get treated like a full launch.
- Use the same scoring scale across teasers, waitlists, beta invites, product pages, and social posts.
- Quiet rollouts matter because they often show up before a loud announcement.
- A heatmap is useful when it helps rank intensity at a glance, not when it tries to explain every source.
- Skip source-by-source deep research here; this page is for grouping and display, not for reliability checks or timelines.
What does a launch signal heatmap do?
A launch signal heatmap shows launch pressure in one view. It maps each signal type to a row, then shades cells by how visible and how early the signal is, so a reader can see a quiet rollout, a soft tease, or a heavier release push without reading every note.
The basic job is ranking, not storytelling. A teaser on a product page and a beta invite in email can both point to launch activity, but they do not mean the same thing. A heatmap keeps those differences visible with one shared scale, often using a 3-level or 5-level shade system.
This format suits people tracking SaaS product intelligence from public signals. It is not the right tool if the only goal is to preserve every raw clue in order. That job belongs to a log, while a heatmap is built to surface patterns quickly.
What signals belong on the heatmap?
The heatmap should include teasers, waitlists, beta invites, product pages, social posts, and quiet rollout clues. Those are the public signals that usually show up before, during, or just after a SaaS release, and they fit well because each one has visible timing and a rough level of launch intensity.
Teasers usually sit in the early, low-commitment zone. A waitlist is stronger because it asks for action, while a beta invite suggests a more active rollout stage. Product pages and social posts can sit in the middle or the high end depending on whether they are static, updated, or clearly announcing release.
Quiet rollout clues need their own row because they are easy to miss. Examples include a live product page before a public push, new signup paths, or a beta invite that appears before any broad announcement. If these clues get folded into “other,” the heatmap loses the one thing it is meant to show: signal pressure by visibility.
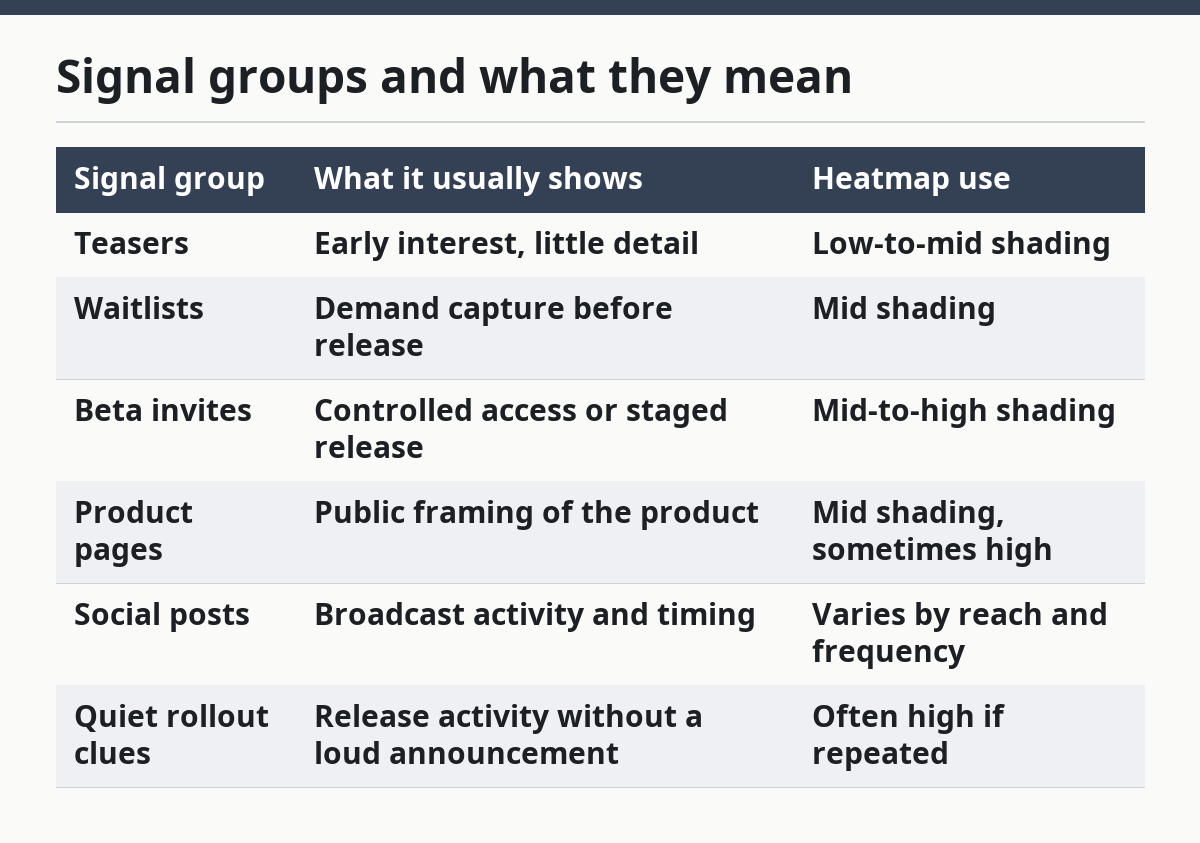
Signal groups and what they mean
| Signal group | What it usually shows | Heatmap use |
|---|---|---|
| Teasers | Early interest, little detail | Low-to-mid shading |
| Waitlists | Demand capture before release | Mid shading |
| Beta invites | Controlled access or staged release | Mid-to-high shading |
| Product pages | Public framing of the product | Mid shading, sometimes high |
| Social posts | Broadcast activity and timing | Varies by reach and frequency |
| Quiet rollout clues | Release activity without a loud announcement | Often high if repeated |
The trade-off is simple: the more groups you add, the easier it is to miss a pattern. A 6-row heatmap is usually clearer than a long list of tiny categories. If a signal type does not change how you read the launch, it probably belongs inside a broader group.
How do you build the heatmap step by step?
Build the heatmap by choosing one scale, one grid, and one rule for each signal before you fill it with data. The goal is to make teasers, waitlists, beta invites, product pages, and social posts comparable in under a minute.
-
Define the grid in a spreadsheet or BI tool and choose 2 axes: signal type on one side and launch stage or timing on the other. A 5-by-5 grid is usually enough to show intensity without turning unreadable.
-
List the signal rows as teasers, waitlists, beta invites, product pages, social posts, and quiet rollout clues. Keep the row names stable so the same type always lands in the same place.
-
Assign one scoring scale, such as low, medium, and high, or 1 to 3, for visibility and launch strength. Use the same scale everywhere so a teaser is not graded more loosely than a beta invite.
-
Tag each event with a date and a stage label, such as pre-launch, release week, or post-launch. The date lets the heatmap show timing, while the stage label keeps a quiet rollout from being mistaken for a late teaser.
-
Shade each cell based on how strong the signal is at that point. A darker shade should mean more intensity, not more importance in the abstract, because the heatmap is about release pressure, not product value.
-
Review the finished view for clumps, gaps, and sudden jumps in color. If one row lights up across several cells, the product may be moving from teaser mode into a broader rollout.
A common mistake is mixing raw notes with summary cells in the same grid. That makes the chart hard to read and turns the heatmap into a scrapbook. Keep the notes in a separate tab or field, then let the heatmap stay clean.
How do you score signal strength?
Score signal strength by measuring how visible the signal is and how close it sits to a clear release moment. A teaser with one post and no follow-up should score lower than a waitlist plus a product page update plus a beta invite, even if they happen on the same week.
The easiest way is to use a 3-level scale. Low means the signal is soft or isolated, medium means it is public and repeatable, and high means it shows up with other launch cues or in a more direct release shape. That keeps the heatmap readable for a first-pass scan.
This is where many generic guides go wrong. They score every public post the same way, which hides intensity. A social post that teases “coming soon” is not equal to a product page that now carries sign-up copy and a beta invite. The first is a hint; the second is closer to a rollout.
A useful rule is to score the signal, not the rumor. If a waitlist is the only proof, keep it in the lower or middle range. If the same product also has a refreshed product page and social posts pointing to sign-up, move the cell darker because the launch is no longer a single clue.
How do you show quiet rollout clues without overcalling them?
Show quiet rollout clues as a separate pattern, not as a headline event. Quiet rollouts often appear as small changes across product pages, beta invites, and social posts before there is a full public push, so the heatmap should make that spread visible without pretending it is a formal launch announcement.
The mistake to avoid is treating one updated page as proof of launch. A quiet rollout is usually a cluster of soft signals, not one loud item. If you shade a single product page change as high intensity, the heatmap starts to overstate release activity.
A better pattern is to reserve the darkest shade for repeated cues across at least 2 signal types. For example, a product page update plus a beta invite is more meaningful than either one alone. If social posts also shift from teaser language to direct sign-up language, the row should darken again.
This matters because quiet rollouts often come before the obvious public moment. A heatmap that only lights up on major announcements misses the early edge that product intelligence users want. The point is not to guess the launch date. The point is to see the build-up in plain view.
What should the heatmap leave out?
The heatmap should leave out source reliability scoring, full launch timelines, and long event notes. Those belong in separate workflows, because each one changes the question the page is trying to answer. This page is about grouping signals by visibility and timing, not about ranking sources or telling a start-to-finish story.
That separation keeps the chart fast to read. If one cell has to answer “what happened,” “when did it happen,” and “how trustworthy is it,” the heatmap becomes too crowded to use. A better setup is one grid for intensity and one separate log for detail.
This is also where the honest limitation sits. A heatmap can show that a launch is getting hotter, but it cannot prove why. It is useful for spotting teaser buildup, waitlist demand, beta activity, product page changes, and social post frequency. It is not built to replace deeper source review.
For readers building a broader workflow, this page fits under the larger SaaS product launch and rollout intelligence hub. The heatmap is one layer in that system, and it works best when it stays focused on visibility rather than trying to solve every launch question at once.
What makes a launch signal heatmap useful in practice?
A launch signal heatmap is useful when it helps a reader decide what is heating up in seconds. The best version uses one simple scale, a small number of clear rows, and a clean split between early cues and louder rollout signals.
If the chart is cluttered, it fails. If every cell uses the same color, it fails. If quiet rollout clues are buried inside generic notes, it fails. The reader should be able to glance at the grid and tell which SaaS product is still teasing, which one is collecting waitlists, and which one is moving into broader release mode.
The practical trade-off is speed versus detail. A compact heatmap gives up some nuance, but it earns speed and comparability. That is the right choice for launch monitoring, especially when the goal is to track multiple products at once rather than write a case study on one release.
What counts as a launch signal?
A launch signal is any public clue that suggests a SaaS product is moving toward release, broader access, or a rollout change. Teasers, waitlists, beta invites, product pages, and social posts all count when they show timing, intent, or a shift in access.
How do you group launch signals by strength?
Group them by how visible they are and how close they seem to a release moment. A teaser is usually weaker than a waitlist, and both are usually weaker than a beta invite paired with a live product page.
How do you tell a teaser from a real rollout?
A teaser hints at what is coming, while a real rollout shows access, sign-up paths, or repeated public changes. One post can tease; a cluster of product pages, beta invites, and social updates looks more like rollout activity.
Drafted with AI; not yet reviewed by a person.