



How to Build a SaaS Launch Comparison Table for Product Hunt, Blog, Email, and Social: use a 5-column SaaS Launch Comparison Table for one launch, four…
Last updated: November 15, 2026
Quick Answer: use a 5-column SaaS Launch Comparison Table for one launch, four channels, and the same four fields: what changed, what proof each channel shows, who each channel speaks to, and what each channel leaves out. This SaaS Launch Comparison Table is the clearest way to compare a SaaS launch across Product Hunt, a blog post, email, and social without confusing channel polish for product change.
Key takeaways
- A SaaS Launch Comparison Table is for spotting the same announcement in different clothes, not for ranking channels by hype.
- Product Hunt usually compresses the message; a blog post usually carries the most detail; email and social often show the first 1-2 claims a team wants repeated.
- The table should compare message, proof, order, and omissions, or it becomes a pile of notes.
- Start with one launch date or launch window, then line up the same claims across the four channels.
- The safer conclusion is often not “which channel won,” but “which channel changed the story most.”
What should the table compare?
A good SaaS Launch Comparison Table compares the same launch across channels using one row per channel and one column per signal. The goal is to make message drift visible in under 5 minutes, not to rewrite the launch in your own words.
Specifically, use the same set of columns for Product Hunt, the blog post, the launch email, social posts, and the press release if it exists. A simple structure with 5 columns is enough: channel, core claim, proof type, call to action, and what is missing. If a team ran a 3-day launch sequence, add a date column so the order is clear.
Because of that, the table should capture omissions as well as claims. If the blog post mentions a product integration, the email does not, and the Product Hunt page only says “new release,” that difference matters. It tells you which audience the team was trying to persuade in each channel.
| Channel | Core claim | Proof type | Call to action | What is missing |
|---|---|---|---|---|
| Product Hunt | Short launch pitch | Headline, tagline, maker comments | Upvote, comment, visit | Deep feature detail |
| Blog post | Full launch story | Screenshots, feature list, examples | Read more, try it | Short-form urgency |
| Launch email | Direct announcement | Subject line, brief summary | Click, sign up, return | Broad context |
| Social post | Fast hook | Short text, image, clip | Like, repost, click | Full explanation |
| Press release | Formal announcement | Quotes, company framing | Media attention, site visit | User-level detail |
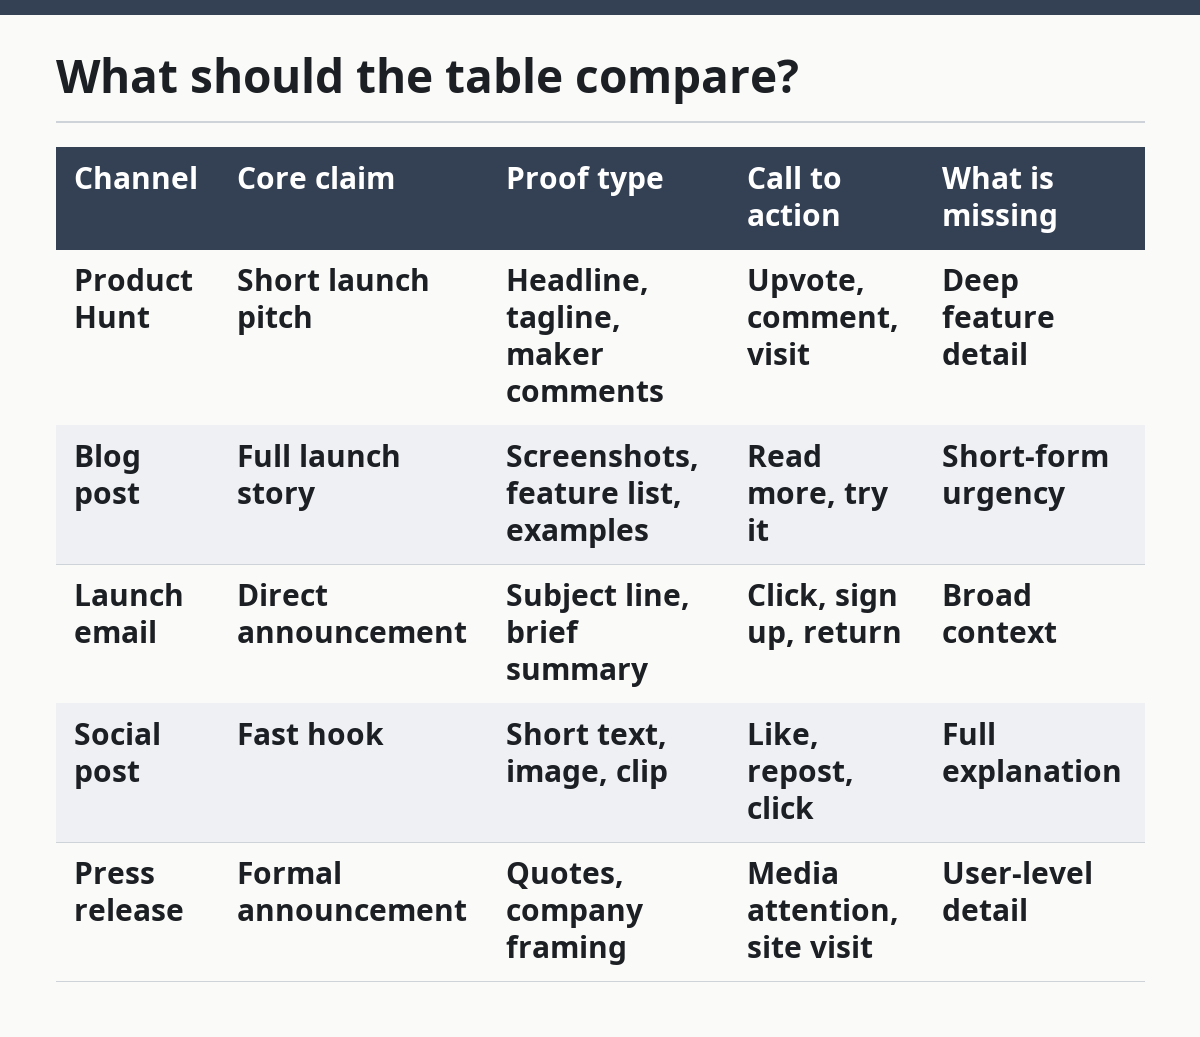
Therefore, that table is not a scorecard. It is a comparison frame. If the launch used a 1-page blog post and a 6-word social post, the table should show that asymmetry plainly instead of pretending each channel had the same job. For Product Hunt’s launch-page format and maker comments, see the Product Hunt Help Center.
How do you compare launch messages across channels?
You compare launch messages across channels by extracting the same 4 items from each one: the headline claim, the proof, the audience cue, and the action the writer wants next. That keeps the comparison grounded in text instead of vibe.
A clean way to do it is to read each channel once, then fill the table in the same order every time:
- Write the launch name in the first row. Use the product name and the launch date or launch window. If the launch spans 2 days, note both dates so you do not mix in later edits.
- Copy the core claim in 10 to 15 words. Keep the wording short. If the Product Hunt page says “faster team planning,” and the blog says “cuts meeting prep time,” those are related but not identical.
- Mark the proof type. Tag it as screenshot, quote, metric, demo clip, feature list, or founder note. A blog post often carries 3 or more proof types, while a social post may carry only 1.
- Record the call to action. “Upvote,” “read,” “book a demo,” and “reply” are not the same. They show the channel’s job.
- List what each channel omits. This is where the table earns its keep. If the email leaves out pricing context or setup details, that absence is part of the launch story.
Accordingly, the best comparison tables do not ask every channel to say everything. They show the division of labor. Product Hunt usually aims for discovery, the blog post for explanation, email for direct conversion, and social for reach or speed.
A strong table also reveals wording drift. If the blog says “new reporting dashboard,” the email says “complete visibility,” and social says “smarter insights,” the launch may be getting broader as it moves outward. That may be intentional, but the table should make it visible. For scannable, consistent presentation, see Nielsen Norman Group’s guidance on clear content structure and scan-friendly writing.
Which columns belong in the table?
The right columns are the ones that help a reader see message drift in 1 pass, not 3. A 5-column table is usually enough; a 7-column version can work if the launch is large and the team used a press release too.
Use these columns first:
- Channel — Product Hunt, blog post, launch email, social post, press release.
- Main claim — the one sentence each channel centers.
- Proof — screenshots, quotes, examples, metrics, or none.
- Audience — makers, users, customers, press, or a mixed group.
- Missing detail — what the channel leaves out that another channel includes.
If the launch was sequenced over 48 hours, add a timestamp column. That matters when the launch message shifts after the first post. A launch on Monday morning can sound different from a follow-up email on Tuesday evening.
For some teams, a tone column helps too: formal, casual, urgent, technical, or promotional. That is useful when the same feature is framed as a product improvement in one place and a growth story in another. Still, tone should stay secondary. The table is about signal, not branding homework.
A generic article often overbuilds the table. It adds columns like “emoji use,” “word count,” or “CTA strength.” Those can be interesting, but they rarely help answer the main question: what changed from one channel to the next? If a column does not help a reader spot drift or omission, cut it.
How should launch sequencing appear in the table?
Launch sequencing should appear as a simple date or order field so the table shows which channel led and which channel followed. That matters because a SaaS launch is often a chain, not a single post.
A useful launch sequence usually looks like this:
- Pre-launch teaser on social or email.
- Launch day post on Product Hunt or the blog.
- Support message in email the same day.
- Amplification posts on social over the next 1 to 3 days.
- Press release if the team wants formal pickup.
You do not need to document every repost. Just capture the first appearance of each channel’s version of the launch. If the Product Hunt post appears at 9:00 a.m. and the email lands 4 hours later, that order may explain why the email uses a shorter hook. A table without sequence can make late support material look like the original message.
Therefore, this section is where many comparisons go wrong. They place all channels side by side and ignore timing, which hides the fact that one channel may be answering another. A social post that quotes the blog headline is not independent evidence; it is downstream messaging.
If the launch involved a press release, note that it often behaves differently from the rest. Press releases are written to be quoted, indexed, and reused. They often sound more formal than Product Hunt or social, and they may include company framing that does not appear elsewhere. That difference is not noise. It is part of the comparison.
What are the trade-offs of Product Hunt, blog, email, and social?
Each channel has a clear use, and each one leaves something out. The table should show both sides so the reader knows what to trust and what to ignore.
| Channel | Best for | Trade-off | Who it is for | Who it is not for |
|---|---|---|---|---|
| Product Hunt | Public launch visibility | Short copy can hide product depth | People scanning for quick discovery | Readers who need full context |
| Blog post | Full explanation | Longer text can slow the first read | Buyers, users, and evaluators | Anyone who only wants the headline |
| Launch email | Direct reach | The audience is limited to your list | Existing subscribers and leads | Cold readers who never opted in |
| Social post | Fast spread | Thin detail and fast decay | Broad awareness and reposts | Readers who need proof-heavy detail |
| Press release | Formal announcement | Can sound polished but generic | Media, partners, and stakeholders | Readers looking for product nuance |
However, the trade-off against the obvious alternative is simple: the richer the channel, the slower it usually is to consume. A blog post may hold the most detail, but a Product Hunt page may be the first place a stranger sees the launch. Email may drive action, but it only reaches the list. Social can spread the message fastest, but it often strips out the evidence.
That is why a SaaS Launch Comparison Table is more useful than a plain channel list. It makes the cost of each format visible. If the product change is subtle, a social-first launch may bury the key point. If the change is big, a Product Hunt card alone may be too thin to carry it.
How do you spot message drift in a launch?
You spot message drift by comparing the nouns, verbs, and proof across channels and asking whether the launch is still about the same product change. Drift is not just wording variety; it is a shift in emphasis that changes what the reader thinks the launch is for.
Look for 3 common signs:
- The claim gets broader. “New team search” becomes “better productivity.”
- The proof gets weaker. A blog post shows screenshots, but social only offers a slogan.
- The audience changes. One channel speaks to users, another speaks to investors or press.
A quick check is to read the main claim in each channel aloud. If you could swap in any other SaaS product and the wording would still fit, the message is too vague. That is especially common in press releases and social copy. The table should make that vagueness easy to see.
The mistake to avoid is treating drift as automatically bad. If this affects pricing claims, regulated features, or legal positioning, consult a qualified marketing or legal professional before treating the shift as harmless. Some drift is normal and even useful. A launch email may need a direct benefit line, while a Product Hunt post needs a short hook. The problem is untracked drift, where the team thinks each channel is saying the same thing but the wording has quietly split in 3 directions.
If you use the table often, keep the same template for every launch. That makes comparisons across launches possible later, not just within one launch window. After 4 or 5 launches, patterns can become visible: one channel may usually be strongest on proof, another on reach, another on urgency.
What does a finished table look like?
A finished table shows one launch in one place and lets a reader see the differences in under a minute. The result should be compact enough for a phone screen and complete enough to support a follow-up decision.
A good final table often has these parts:
- One launch name and date at the top.
- 4 or 5 channel rows.
- 5 core columns.
- Notes on omissions or shifted claims.
- A short conclusion about which channel carries the clearest version of the launch.
The conclusion should not be “the blog is best” or “social wins.” That answer depends on the job. If the goal is depth, the blog usually carries more detail. If the goal is public discovery, Product Hunt may lead. If the goal is direct action from an existing list, email may do more work. The table should help the reader see that choice, not flatten it.
For the broader SaaS product launch and rollout intelligence hub, this SaaS Launch Comparison Table works as the comparison layer that sits between raw signals and later analysis. It turns separate posts into one readable launch map. See also the launch analysis template and social launch checklist.
How do you compare launch messages across channels?
You compare launch messages across channels by lining up the same claim, proof, and call to action from Product Hunt, the blog post, email, and social post. The result shows what each channel emphasizes and what it leaves out. A side-by-side table works better than notes because it exposes drift in 1 pass.
Why do launch posts differ by channel?
Launch posts differ by channel because each format has a different job and a different audience. Product Hunt is built for discovery, the blog post for detail, email for direct response, and social for speed. A press release adds a formal layer that often reads more polished and less specific.
How do you spot message drift in a launch?
You spot message drift by checking whether the same launch still sounds like the same product change in every channel. If the claim gets broader, the proof gets thinner, or the audience shifts, the message has moved. A table makes that shift visible before it becomes a reporting mistake.
Drafted with AI; not yet reviewed by a person.