





How to Build a SaaS Feature Flag Launch Plan for Gradual Release, Access Control, and Rollback: A SaaS feature flag launch plan controls software delivery…
Last updated: November 18, 2026
A SaaS feature flag launch plan controls software delivery by separating code deployment from feature exposure. To run a safe release, ship dormant code to production, assign users to progressive release cohorts, and use automated kill switches to disable the flag instantly if error rates spike. This operational discipline forms a core pillar of modern saas product launch operations.
Key Takeaways
- Feature flags isolate code deployment from customer release, turning high-risk code pushes into low-risk configuration toggles.
- Reliable cohort targeting relies on deterministic user hashing rather than random client-side sampling.
- A structured launch plan uses defined soak periods at 1%, 5%, 25%, and 100% allocations to catch system regressions early.
- Automated kill switches tied to telemetry thresholds prevent outages before human operators notice an issue.
- Every toggle introduces technical debt and must carry an explicit expiration date set during the initial implementation.
What is a SaaS feature flag launch plan?
A SaaS feature flag launch plan is an operational schedule that governs how a new capability activates for specific users over time. Instead of exposing new code to an entire customer base simultaneously, the plan defines evaluation rules that read user context at runtime. Martin Fowler’s taxonomy of Feature Toggles divides these controls into release flags, experiment flags, ops toggles, and permission flags. A feature flag launch plan focuses primarily on release toggles and operational safety switches.
The mechanism relies on conditional statements embedded directly in the application code. A central configuration service stores the target state of each flag. When an execution thread hits a decision point, it queries an in-memory cache or an external toggle provider to determine if the path evaluates to true or false for the current user.
“`
+————————————————————-+
| Application Runtime |
| |
| User Request —> [ User Context: Tenant, Region, ID ] |
| | |
| v |
| [ Feature Toggle Router ] |
| | |
| +——————-+——————-+ |
| | (Flag = FALSE) | (Flag = TRUE)
| v v |
| [ Legacy Logic ] [ New Feature ]|
+————————————————————-+
^
| Sync Rules
[ Evaluation Engine / Cache ]
^
| Read State
[ Config Service / Flag Store ]
“`
Building this structure requires engineering and product teams to agree on exposure criteria before writing code. If a launch plan lacks clear bounds, teams leave flags active indefinitely, generating unmanageable branch complexity. Modern enterprise environments standardize these implementations against vendor-agnostic standards like OpenFeature, which unifies evaluation interfaces across multiple programming languages.
This approach is not suited for early-stage prototypes with fewer than fifty active accounts. In those environments, the overhead of maintaining duplicate code paths outweighs the risk of brief downtime. For growing SaaS systems handling hundreds of concurrent tenants, a documented plan is necessary to preserve platform stability during frequent deployments.
How do you configure access control and release cohorts?
Access control within a release plan determines the exact criteria an account must meet to evaluate a flag as true. A reliable strategy organizes exposure by identity attributes rather than simple random percentages across all server traffic.
Targeting begins with internal users. An internal cohort matches accounts using corporate email domains or internal role-based access control (RBAC) permissions. Engineers, product managers, and customer support representatives work in this phase to confirm functional behavior under standard production workloads.
Once internal validation completes, exposure moves to external tenants. Multi-tenant software requires targeting rules that isolate entire accounts rather than individual users within an account. Exposing a billing update to half of the finance team at an enterprise client causes data mismatches and support escalations. Account-level targeting relies on a stable tenant identifier, such as a tenant UUID.
“`
[ Production Traffic ]
|
+———————+———————+
| |
[ Internal Cohort ] [ External Cohort ]
- @company.com domains – Hashed Tenant UUID
- Flag = TRUE (All features) – MurmurHash3 mod 100
|
+——————–+——————–+
| | |
Cohort 1: 1% Cohort 2: 5% Cohort 3: 25%
(Soak 24 hrs) (Soak 48 hrs) (Soak 72 hrs)
“`
To assign tenants to cohorts without storing massive lists of identifiers, engines use deterministic hashing algorithms like MurmurHash3. The engine hashes the tenant UUID combined with the flag key:
$$\text{Bucket Value} = \text{MurmurHash3}(\text{tenant_id} + \text{flag_key}) \pmod{100}$$
This calculation produces an integer between 0 and 99. If the current release cohort specifies a 5% rollout, any tenant whose hash resolves to 0, 1, 2, 3, or 4 receives the new feature. Because the calculation is deterministic, the tenant remains in that cohort across sessions and devices without database lookups. Changing the threshold to 25% instantly expands the cohort to hash values through 24, keeping the initial 5% group intact while adding new users predictably.
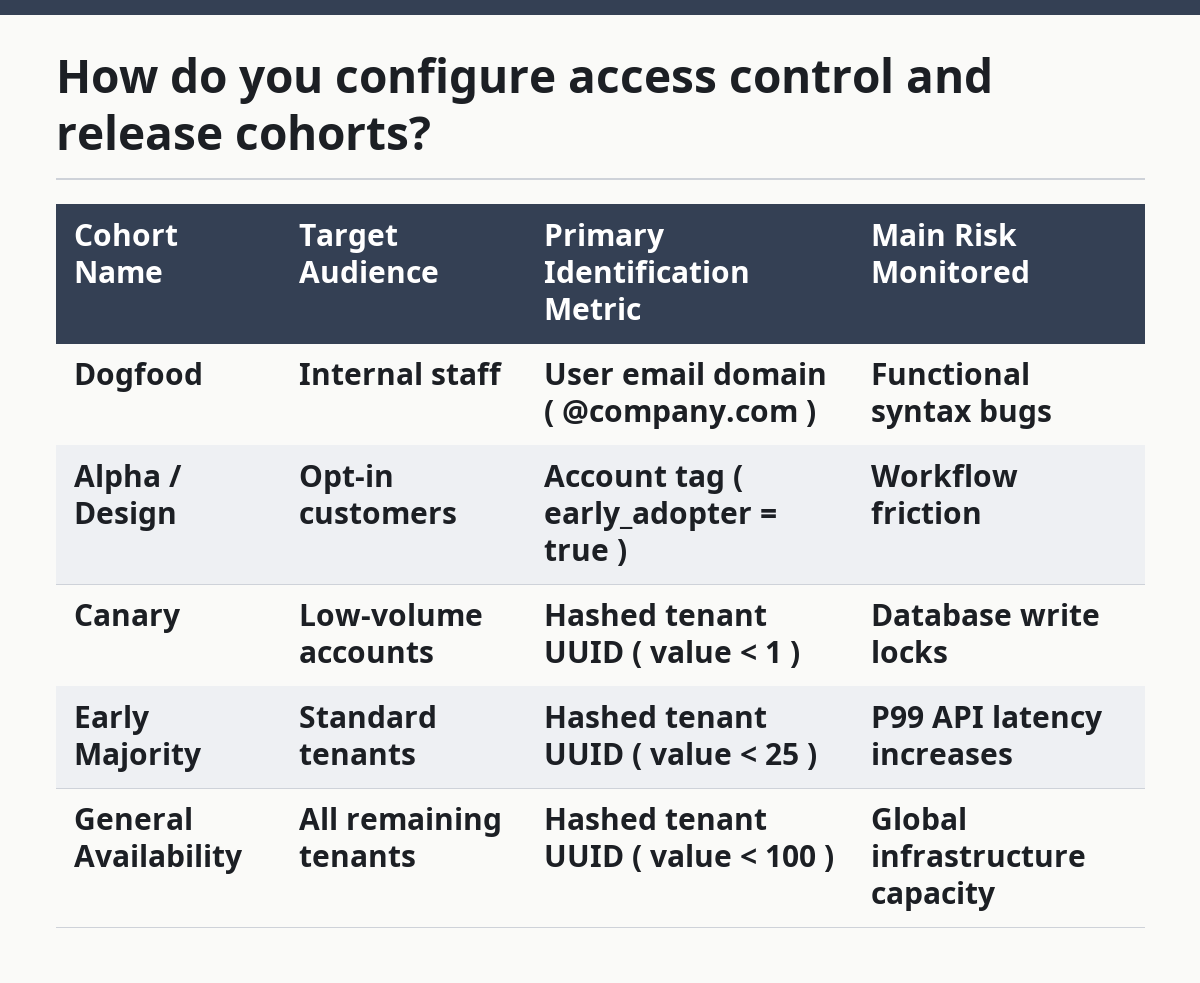
| Cohort Name | Target Audience | Primary Identification Metric | Main Risk Monitored |
|---|---|---|---|
| Dogfood | Internal staff | User email domain (@company.com) |
Functional syntax bugs |
| Alpha / Design | Opt-in customers | Account tag (early_adopter = true) |
Workflow friction |
| Canary | Low-volume accounts | Hashed tenant UUID (value < 1) |
Database write locks |
| Early Majority | Standard tenants | Hashed tenant UUID (value < 25) |
P99 API latency increases |
| General Availability | All remaining tenants | Hashed tenant UUID (value < 100) |
Global infrastructure capacity |
What are the stages of a gradual release schedule?
A gradual release schedule exposes code to incremental slices of user traffic to evaluate infrastructure health and application correctness under real-world load. Every stage enforces a strict minimum duration, known as a soak period, before traffic increases.
[ Stage 0: 0% ] -> Internal Only

       |

       v (Verify logs: 2 hours)

[ Stage 1: 1% ] -> Canary

       |

       v (Soak period: 24 hours | Error Rate < 0.05%)

[ Stage 2: 5% ] -> Expanded Cohort

       |

       v (Soak period: 48 hours | P99 Latency < 250ms)

[ Stage 3: 25% ] -> Significant Load

       |

       v (Soak period: 72 hours | Database CPU < 65%)

[ Stage 4: 50% ] -> Parity Test

       |

       v (Soak period: 24 hours | No regression tickets)

[ Stage 5: 100% ] -> General Availability
Stage 0: Dark Deployment (0% External Traffic)
The code is deployed to production clusters, but the toggle evaluates to false for all non-internal identities. Synthetic monitoring suites and automated integration tests run against production endpoints using test accounts. This phase runs for at least two hours to ensure the new binary boots, registers with service registries, and causes no memory leaks while idle.
Stage 1: Canary Release (1% Allocation)
The flag router targets a narrow group: either opt-in beta customers or 1% of standard accounts through the hashing algorithm. High-tier enterprise accounts with custom service level agreements (SLAs) must be explicitly excluded from this group. The 1% allocation runs for a full 24-hour business cycle to collect metrics across varied time zones and peak usage hours.
Stage 2: Low-Risk Exposure (5% Allocation)
Expanding the allocation to 5% tests concurrency. Edge-case exceptions that occur once in every ten thousand requests begin to emerge in application logging. This stage requires a minimum 48-hour soak period. Engineers monitor memory allocations and thread pools to confirm background worker queues clear within established parameters.
Stage 3: Broad Exposure (25% Allocation)
Moving to 25% introduces substantial read and write load to database tables. If the new feature relies on altered query patterns, unindexed columns will show up here as database CPU spikes. The team monitors downstream dependencies, such as external messaging APIs or authentication providers, to confirm they do not throttle the application. This stage remains active for 72 hours.
Stage 4: High Exposure (50% Allocation)
At 50%, system traffic is divided evenly between legacy and current code paths. This is the optimal window to compare operational telemetry side by side. Run this stage for 24 hours to confirm API response times remain comparable across both paths.
Stage 5: General Availability (100% Allocation)
The flag router evaluates to true for all tenants. The feature is completely exposed, but the conditional code path remains in the software binary for a defined window. The launch plan now transitions from monitoring active rollout metrics to tracking retirement dates for the toggle logic itself.
How do you execute the rollout step by step?
Executing a product release via feature flags demands consistent operational steps across the engineering and deployment pipeline.
[ Step 1: Initialize Flag ]

                   |

                   v

       [ Step 2: Implement Fallback ]

                   |

                   v

       [ Step 3: Configure Metrics Baseline ]

                   |

                   v

       [ Step 4: Advance Percentage Gate ]

                   |

                   v

       [ Step 5: Archive and Clean Code ]
- Initialize the flag configuration in your toggle engine. Create the flag key using a standard naming convention, such as
release_billing_v2_migration, set the default state todisabled, and configure fallback behavior to evaluate asfalsewhenever network partitions disrupt calls to the toggle provider. - Implement the fallback and active paths in the application code. Wrap the new logic in an
if/elseblock, ensuring that both branches return identical interface types to the calling controller so that downstream execution does not fail regardless of the state returned. - Establish telemetry baselines before changing toggle states. Record existing P95 latency (e.g., 180 milliseconds) and HTTP 5xx error rates (e.g., below 0.02%) across production services during peak operating hours to serve as a baseline for release gates.
- Advance the targeting gate to the next cohort threshold. Update the target rule in the flag management dashboard to point to the desired percentage, verify through runtime audit logs that user assignments update within 60 seconds, and observe real-time telemetry.
- Archive the toggle and delete legacy code paths. Once the flag operates at 100% for 14 consecutive days without an operational incident, open an engineering ticket to strip out the
if/elsewrapper and remove the flag from the configuration database.
How do you design an automated rollback strategy?
An automated rollback strategy uses continuous health telemetry to flip a feature flag back to false without human intervention. Reverting a flag configuration takes milliseconds, while redeploying a container or rolling back a release pipeline can take ten to thirty minutes.
Rollback rules depend on clear metrics tied to service-level objectives (SLOs). The most common triggers rely on application error budgets and response performance:
| Observability Platform |
| |
| [ Metric: P99 Latency > 250ms for 3 mins ] |
| [ Metric: HTTP 500 Rate > 1.0% for 1 min ] |
+——————————————————-+
|
v Alert Webhook
+——————————————————-+
| Automated Remediation Engine |
| |
| 1. Intercept Webhook Payload |
| 2. Match Alert to Flag ID: release_billing_v2 |
| 3. Call Toggle API: PATCH /flags/state -> FALSE |
| 4. Dispatch Incident Alert to Slack/PagerDuty |
+——————————————————-+
|
v Immediate Propagation
+——————————————————-+
| Production Application Nodes |
| |
| – Feature Flag Cache Invalidated |
| – Traffic Reverts to Legacy Code Path |
+——————————————————-+
“`
To configure this loop, link your monitoring system to the toggle provider via Webhooks:
- Error Rate Trigger: The platform triggers a kill switch if the HTTP 500 error rate on endpoints handling the feature exceeds 1% of total requests for two consecutive evaluation minutes.
- Latency Trigger: The platform triggers a kill switch if the 99th percentile (P99) response time climbs above 250 milliseconds over a three-minute rolling window.
- Database Trigger: The platform triggers a kill switch if thread pools reach 85% capacity or database CPU utilization sustains 80% for five minutes.
When any threshold breaches, the monitoring platform calls the feature flag API to disable the toggle globally.
[ Schema Change ]

                                          |

                                          v

                              [ Add Nullable Columns ]

                                          |

                                          v

     +------------------------------------+------------------------------------+

     |                                                                         |

     v                                                                         v

[ Code Path A: Old ]                                                      [ Code Path B: New ]

Reads/writes legacy columns                                               Reads/writes both columns

                                                                                       |

                                                                                       v

                                                                          [ Safe to Roll Back Flag ]

                                                                          Data remains backward-compatible
The most challenging constraint in automated rollbacks involves state and data storage. If a new feature writes data to a database in an updated schema, flipping the flag back to the old code path will corrupt or break application reads unless backward compatibility was maintained.
Drafted with AI; not yet reviewed by a person.